Presentation · PDF
Charging in Switzerland 2026: network, bottlenecks and charging prices
The presentation sums up what our data show about charging in Switzerland: how many charging points there are, where most charging happens, where all fast chargers are occupied at the same time and why the same kilowatt hour can cost six times as much. It is a snapshot. The figures we keep updating are in the Charging tab and in live occupancy.
Key points
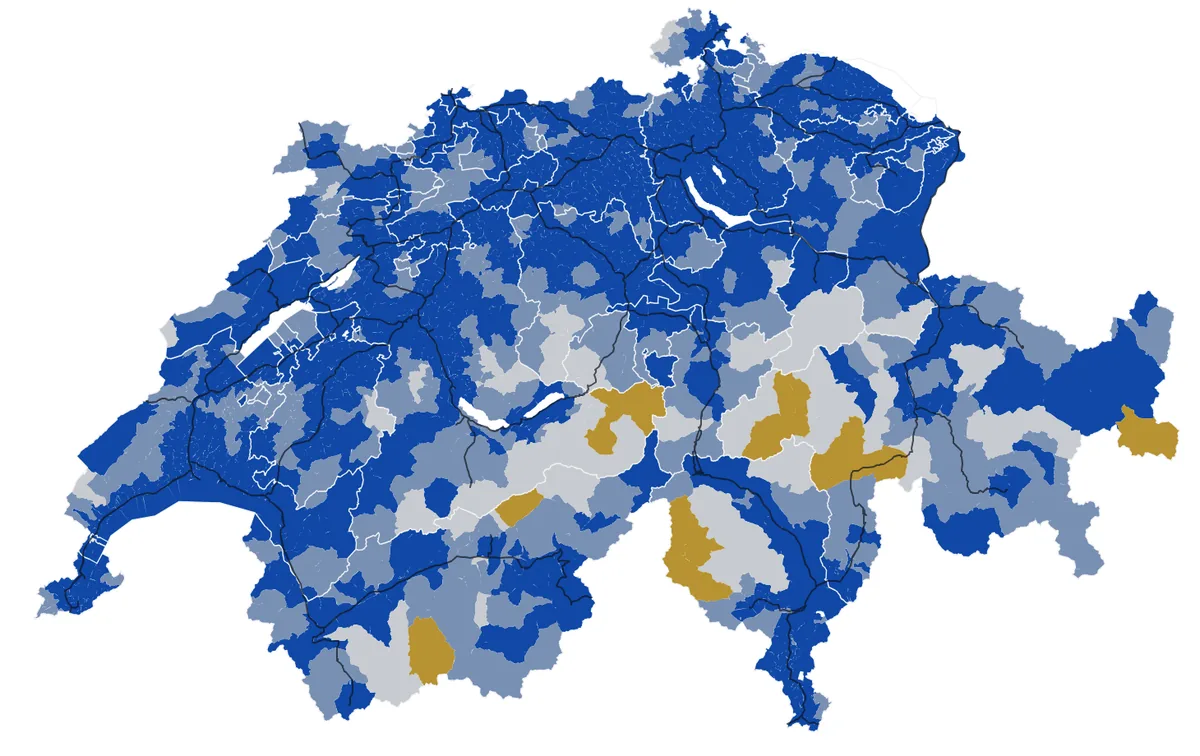
- 90,7 % of the population live within 5 km as the crow flies of the nearest fast charger, 98,7 % within 10 km. On the national roads the nearest fast charger is nowhere further than 18,7 km.
- At 87 of 480 locations all fast chargers were occupied for at least 30 minutes a day on average, at 37 for over an hour. This mostly concerns locations with only two fast chargers.
- Only 25,0 % of charging locations report their price. Reported prices range from CHF 0.18 to 1.08 per kWh, a factor of 6.
- There are gaps in 17 municipalities with 11’759 inhabitants in total that lie more than 15 km from the nearest fast charger, mostly valleys in Ticino, Graubünden and Valais.
Download
The same presentation in four languages, 19 landscape pages each. The links in the PDF lead to the current figures on wattradar.ch.
- Charging in Switzerland 2026 · English · PDF, 19 pages, 2,4 MB
- Laden in der Schweiz 2026 · Deutsch · PDF, 19 Seiten, 2,4 MB
- La recharge en Suisse 2026 · Français · PDF, 19 pages, 2,4 MB
- La ricarica in Svizzera 2026 · Italiano · PDF, 19 pagine, 2,3 MB
How dense the network is
Each municipality is coloured by the distance from its centre to the nearest public charging location above 42 kW. Blue means up to 5 km, gold more than 15 km.
What is inside
- Market: share of new cars with a plug
- Charging network: locations, stations and connectors, fast chargers by power
- Maps: network density, fast charging sessions per location, locations without a free fast charger
- Occupancy: sessions per charging point and day, idle points, outages, occupancy by canton and hour
- Prices: how many locations report their price and how far prices differ
- Annual costs for 12’000 km: charging at home, charging in public, petrol
What the figures do not say
- Distances are measured as the crow flies from the centre of a municipality, not along the road.
- The count is how long all fast chargers at a location reported “occupied”. We did not measure waiting time, and a car may stay parked after charging.
- Occupancy is from the week 10.–16.10.2026, charging prices from 17.10.2026, network density from 25.10.2026.